Introduction: Navigating B2B Marketing Spend Benchmarks for Growth
The Challenge of Getting Marketing Budget Right
Setting the right marketing budget is one of the most critical—and challenging—decisions B2B leaders face. The stakes are high: under-spend and you’ll stall growth; over-spend and you’ll drain resources without proportional returns. The problem is that many companies approach budgeting in isolation, disconnecting their marketing spend from actual revenue goals. This misalignment often leads to failed marketing plans and wasted investment.
This is where marketing spend benchmarks become invaluable. They serve as a reality check, helping you validate whether your investment is realistic compared to industry peers. Are you investing too little to compete? Too much without seeing returns? Benchmarks provide that critical perspective.
Understanding the Benchmark Range
Across aggregated research, most B2B companies allocate between 7% and 12% of revenue to marketing, though this range varies significantly by industry and business model. Here’s what’s important to understand: smaller organizations typically need to spend a higher percentage of revenue on marketing to build awareness and establish credibility. Larger, more established companies can operate at lower percentages while still deploying substantial absolute dollars.
The trend is upward. 69% of marketers expect budget increases by 2026, with average B2B marketing spend rising from 9% to 10% of revenue. However, treating the 7-12% range as gospel is a mistake—it’s a guide, not a mandate.
Beyond the Percentage: Strategic Allocation Matters
Here’s the real secret: success isn’t about having the biggest budget. It’s about how you allocate those dollars. The actual percentage you should spend depends heavily on your company’s growth stage, go-to-market strategy, and revenue goals. A startup pursuing hyper-growth will need a different approach than an established company optimizing for profitability.
The most successful approach grounds your strategy in your current position and future ambitions. Translate those percentages into a concrete budget aligned with your revenue goals, funnel performance, and unit economics. Build in flexibility—reserve 15-25% of your budget for testing and pivots. Review and adjust monthly rather than locking into rigid annual plans.
Remember: benchmarks are your starting point, not your destination. Use them alongside your specific funnel math, conversion rates, and sales cycle length to create a budget that actually works for your business.
The Shifting Landscape of B2B Marketing Budgets
The B2B marketing landscape is undergoing a significant transformation, with companies increasingly recognizing the importance of strategic budget allocation. The data tells a compelling story: 69% of marketers expect budget increases by 2026, signaling a broader shift in how organizations prioritize marketing investments.
In 2025, B2B companies are allocating an average of 9.4% of their revenue to marketing—a notable jump from 7.7% in 2024. This upward trend reflects the growing recognition that marketing spend directly correlates with business growth and market competitiveness. However, the percentage varies considerably depending on company maturity and go-to-market strategy, making it essential to understand where your organization fits within this evolving landscape.
Marketing Spend by Company Stage
The amount companies invest in marketing isn’t one-size-fits-all. Marketing spend as a percentage of revenue varies significantly by company stage, with pre-product-market fit companies investing 30–60%+ of revenue, while early-growth stage companies allocate 35–50%. As companies scale, these percentages normalize: scaling-stage companies typically spend 15–25% of revenue, while mature, established organizations settle into the 5–7% range.
Your go-to-market motion also plays a critical role. Product-Led Growth (PLG) firms allocate a median of 13% of revenue to marketing, with heavier investments in technology and tools. Sales-Led Growth (SLG) companies average 9% of revenue, while ABM hybrid models sit at 10%, emphasizing personalization and account-specific tooling.
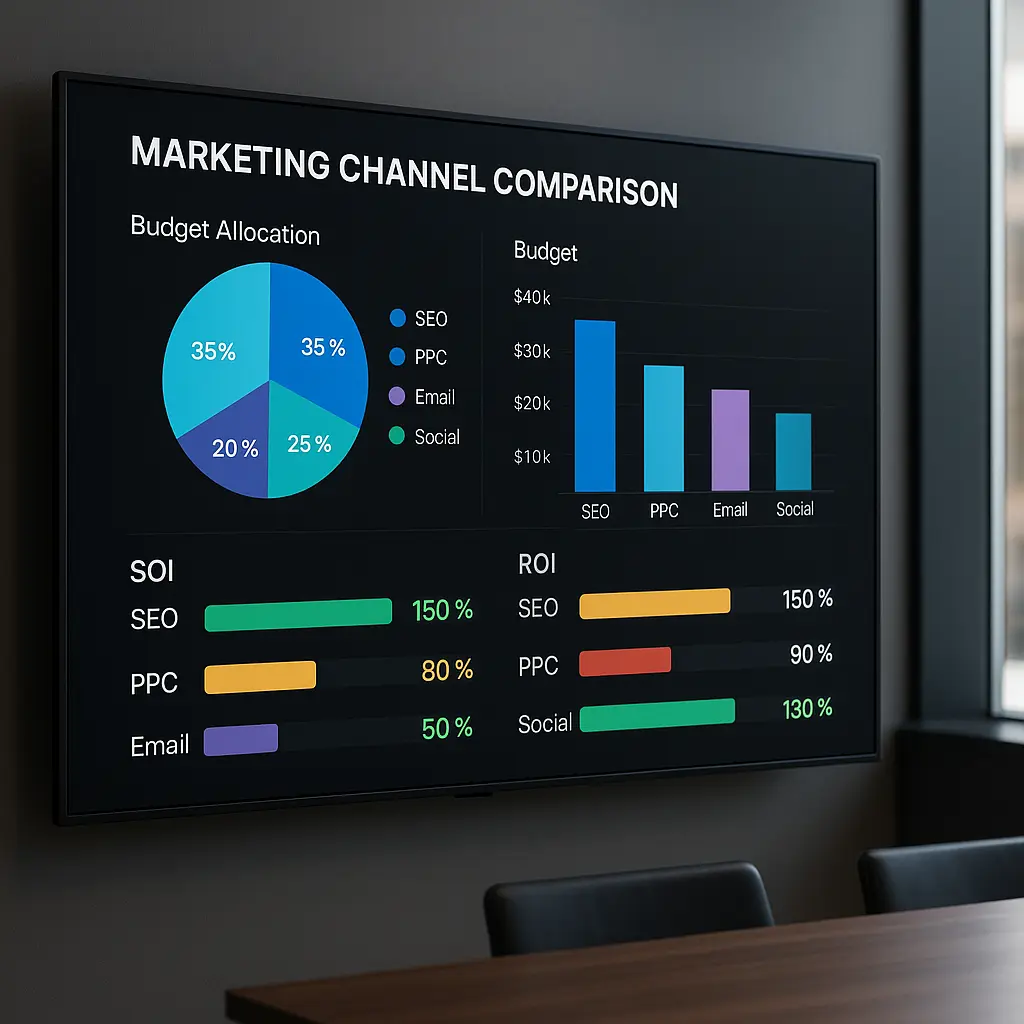
Budget Allocation Across Categories
Understanding how to distribute your marketing budget is just as important as determining the total amount. Personnel typically consumes 30–40% of marketing budgets (sometimes reaching 45–55%), while paid demand generation accounts for 18–42%. Content and brand initiatives capture 14–16%, with tools and data infrastructure taking 12–17%—a category experiencing rapid growth as companies invest in AI capabilities.
Industry context matters too. Technology and software companies typically allocate 9.16–15% of revenue to marketing, while financial services range from 7.2–11.18%, and healthcare organizations spend 5.9–9.31%, prioritizing thought leadership and in-person engagement.
For companies in the $10 million to $50 million revenue range, most allocate between 7% and 12% of revenue, with media spend consuming 50–60% of total marketing budgets, martech accounting for 15–20%, people and agencies representing 20–30%, and events and sponsorships taking 5–15%.
Revenue Stage 1: $1M–$3M – Establishing Your Foothold
Understanding Your Budget Range
When you’re operating in the $1M–$3M revenue range, you’re at a critical inflection point where strategic marketing investment becomes the difference between stalling and scaling. Companies in this stage typically allocate 10-15% of revenue to marketing, which translates to a monthly budget of $10,000–$50,000 depending on where you sit within this revenue band.
This percentage-based approach isn’t arbitrary—it reflects the reality that early-stage companies need consistent, meaningful investment to build awareness, enter new markets, and establish a credible brand presence. For context, a company at the $3M revenue mark spending 12% would allocate roughly $360,000 annually to marketing initiatives.
Strategic Budget Allocation for Early Growth
At this stage, your focus should shift from pure experimentation to scaling what’s already working. Post-Product-Market Fit companies typically allocate 35–50% of their marketing budget across proven channels, but this doesn’t mean abandoning discipline.
Here’s how to structure your Early-Stage Lean Budget:
- Content Marketing (20–40%): This is your long-term competitive advantage. Invest heavily in SEO, blog content, and thought leadership pieces.
- Paid Channels (10–20%): Allocate to high-intent campaigns that drive immediate pipeline.
- PR & Awareness (10–20%): Build credibility through strategic partnerships and media placements.
- Website Optimization (10–20%): Ensure your digital storefront converts visitors into leads.
- Email Marketing (10–15%): Nurture existing relationships and build your owned audience.
- Tools & Technology (4–6%): Invest in platforms that enable scalability without proportional headcount growth.
Protecting Your Future Growth
One critical principle at this stage: keep 15-25% of your budget flexible for tests or pivots. This buffer allows you to respond to market opportunities without derailing your core strategy.
Equally important—don’t cut corners on SEO or community building. These channels require 1.5 to 3 years to mature and are expensive to rebuild once abandoned. Be ruthless about ROI on brand awareness that doesn’t convert, but protect investments in channels that compound over time. The companies that win at this stage are those who balance short-term pipeline generation with long-term competitive positioning.
Revenue Stage 2: $3M–$10M – Scaling What Works
Finding Your Marketing Sweet Spot
At the $3M–$10M revenue stage, you’re in a critical growth phase where strategic marketing investment becomes your competitive advantage. Companies under $10 million in revenue typically allocate between 10 to 15 percent of their revenue to marketing efforts. For context, a $5 million company operating at this 12 percent benchmark would be investing approximately $600,000 annually into marketing—a substantial commitment that reflects the importance of this growth stage.
However, if you’re on the more aggressive end of the scaling spectrum, particularly in the $1M–$5M range, you might find yourself allocating 15–25% of revenue to marketing. This higher investment rate reflects the intense focus required to establish market presence and build momentum during early growth phases. The key is understanding where your company sits within this range and why.
Strategic Budget Allocation for Pipeline Generation
As you scale from $3M to $10M, your marketing priorities shift dramatically. Your focus transitions from simply building awareness to scaling what’s working through repeatable systems and content engines. The typical monthly marketing budget for companies in this revenue band ranges from $50,000 to $100,000, giving you meaningful resources to execute sophisticated strategies.
For companies generating $5M–$20M in annual recurring revenue, the allocation strategy becomes more nuanced. Your budget should prioritize high-intent channels, with 60–80% directed toward paid search and LinkedIn advertising where your ideal customers actively search for solutions. Simultaneously, dedicate 10–20% to brand building through thought leadership and PR initiatives, while reserving another 10–20% for lead nurturing campaigns that convert prospects into customers.
This balanced approach ensures you’re not just generating pipeline volume, but building sustainable competitive advantages through brand recognition and customer relationships that extend beyond any single campaign.
Revenue Stage 3: $10M–$25M – Mid-Market Expansion
Finding Your Optimal Marketing Budget
At the $10M–$25M revenue stage, your company has entered mid-market territory—a critical inflection point where marketing investment becomes increasingly strategic. Companies between $10M and $50M in revenue typically allocate 7% to 12% of their annual revenue to marketing efforts. To put this in perspective, a $25 million company operating at the 10% benchmark would have $2.5 million in annual marketing budget to deploy.
However, your specific allocation depends on your growth mode. If you’re in aggressive expansion, you might operate in growth mode with marketing spend reaching 15-25% of revenue. Conversely, if you’re optimizing for efficiency, a 7-10% allocation is more appropriate. This flexibility allows you to calibrate your spending based on market conditions, competitive pressures, and your growth objectives.
Strategic Priorities and Channel Allocation
The mid-market expansion stage demands a shift in focus. Rather than simply acquiring leads, your priority becomes generating pipeline predictably, refining your brand positioning, and enabling your sales team to close deals faster. Key investments at this stage include paid media at scale, account-based marketing programs, marketing automation tools, and dedicated internal resources.
For companies generating $5M–$20M in annual recurring revenue, a “Pipeline Push Budget” approach works exceptionally well. This strategy allocates your resources strategically: 60–80% flows to high-intent channels like paid search and LinkedIn advertising, where your ideal customers actively search for solutions. The remaining budget splits between brand building (10–20%) and lead nurturing programs (10–20%), ensuring you maintain visibility while developing relationships with prospects throughout their buying journey.
Scaling Without Adding Headcount
One of the biggest challenges at this stage is scaling output without proportionally increasing your team size. Fortunately, AI and marketing automation tools can automate repetitive tasks, allowing your existing team to accomplish more. This is why marketing automation investments become non-negotiable at the $10M–$25M stage.
When building your budget, adopt a bottom-up approach rather than simply applying a percentage to revenue. Factor in your customer acquisition cost (CAC), average contract value (ACV), and revenue targets to determine how much you actually need to spend to hit your growth goals. This data-driven methodology ensures every dollar works toward measurable business outcomes.
Revenue Stage 4: $25M–$50M – Maturing and Optimizing
Strategic Spending and Budget Allocation
At the $25M–$50M revenue stage, companies enter a critical phase where marketing becomes increasingly sophisticated and data-driven. Marketing spend benchmarks for this revenue tier typically range from 7% to 12% of total revenue. To put this in perspective, a $25 million company operating at the 10% benchmark would allocate approximately $2.5 million annually to marketing initiatives.
However, your specific allocation depends on your growth strategy. Companies in “Efficiency Mode” maintain spending at 7–10% of revenue, while those pursuing aggressive expansion in “Growth Mode” may invest 15–25%. This flexibility allows you to balance profitability with market penetration based on competitive dynamics and expansion goals.
The primary focus at this stage shifts toward generating predictable pipeline, refining your brand positioning, and enabling your sales team with better tools and resources. You’re no longer in pure acquisition mode—instead, you’re optimizing for sustainable, repeatable growth.
Budget Breakdown and Channel Priorities
As your company matures, your marketing budget by company size should follow a strategic allocation framework. For scaling companies, the recommended split is approximately 50–60% toward demand generation activities, 20–30% toward brand building and content initiatives, and 20–30% toward marketing tools and data infrastructure.
Demand generation remains your largest investment, but it’s now more targeted and account-focused. High-intent channels like paid search and LinkedIn advertising typically capture 60–80% of demand generation budgets, while lead nurturing and brand awareness activities receive the remaining allocation. This ensures you’re capturing ready-to-buy prospects while maintaining brand equity for long-term growth.
Key investments at this stage include paid media at scale, account-based marketing (ABM) programs, sophisticated marketing automation platforms, and dedicated internal marketing resources. These investments support your sales team’s efficiency and help you maintain healthy customer acquisition costs (CAC) as you scale.
Balancing Efficiency with Growth
The $25M–$50M stage represents a maturation point where you can’t simply throw budget at growth anymore. Instead, success requires strategic allocation that maintains healthy unit economics while supporting expansion into new markets or customer segments. By adhering to B2B marketing spend benchmarks and continuously monitoring performance across channels, you’ll ensure your marketing investment drives predictable, profitable revenue growth.
The Evolution of Marketing Channel Mix Across Revenue Stages
Early-Stage Companies: Building Awareness and Testing Channels
When companies operate under $2M ARR, marketing spend becomes a critical growth lever. These early-stage businesses typically allocate 20–40% of revenue to content marketing, with the remainder distributed across paid channels, PR, website optimization, and email marketing. Companies in this phase are focused on establishing brand presence and entering new markets, often dedicating 10–15% of total revenue to marketing initiatives. The channel mix during this period emphasizes experimentation—testing which motions resonate with their target audience while building foundational brand awareness.
For early-stage B2B SaaS companies, the approach differs based on go-to-market model. Product-Led Growth (PLG) firms spend a median of 13% of revenue on marketing, allocating 52% to programs and 32% to personnel. Meanwhile, Sales-Led Growth (SLG) firms average 9% of revenue, with 44% on programs and 44% on staffing. This distinction matters: PLG companies invest more heavily in technology and self-serve experiences, while SLG companies prioritize sales enablement and personnel.
Mid-Market Scaling: Doubling Down on High-Intent Channels
As companies scale from $5M to $20M ARR, their marketing channel mix undergoes a significant transformation. The focus shifts dramatically toward high-intent channels, with 60–80% of budgets allocated to paid search and LinkedIn. This “pipeline push” phase emphasizes predictable revenue generation over brand building. Companies in this range typically spend 7–12% of total revenue on marketing, with increased investment in paid media at scale, marketing automation, and dedicated internal resources.
LinkedIn has cemented its dominance in B2B, with 66% adoption and growing budget share at 39% in 2025, delivering 113% ROAS. In contrast, Google Search Ads (non-branded) generate only 78% ROAS, and Facebook/Meta delivers just 29%. For companies with average contract values (ACVs) above $25,000, Account-Based Marketing (ABM) achieves 81% higher ROI and 60% higher win rates, making it an essential channel mix component during this growth phase.
Enterprise Stage: Balancing Demand Generation and Brand Leadership
Companies exceeding $50M revenue operate with fundamentally different channel economics. These organizations typically spend 6–10% of revenue on marketing, with channel allocation shifting to 60–70% on demand generation, 20–30% on brand building, and 10–20% on lead nurturing. The overall marketing budget breaks down into media spend (50–60%), martech investments (15–20%), people and agencies (20–30%), and events/sponsorships (5–15%).
At this scale, companies support multiple business units and large sales teams through integrated campaigns, sophisticated martech stacks, and specialized teams. The channel mix reflects this complexity—while high-intent paid channels remain important, enterprise organizations increasingly invest in brand campaigns, sponsorships, and global media buys to sustain market leadership across multiple regions and customer segments.
Beyond Percentages: The Importance of Absolute Spend and Strategic Allocation
Why Percentages Alone Miss the Mark
Relying solely on industry benchmarks like the “standard range” of 7-12% of revenue can be dangerously misleading. Looking only at percentages overlooks a critical reality: absolute dollars determine your reach, content production capabilities, technology stack, and talent support. Two companies with identical revenue percentages can operate in completely different universes when it comes to actual marketing firepower.
The real insight? Smaller companies typically need to spend a higher percentage of revenue to achieve growth, while larger enterprises can spend less as a percentage but deploy far more in absolute dollars. This distinction is crucial when scaling from $1M to $50M—your percentage might decrease, but your total spend should increase dramatically to maintain momentum.
From Benchmarks to Bottom-Up Budgeting
The question isn’t “how much should we spend on marketing?”—it’s “how much does it cost to find, nurture, and acquire a customer of this value?” This shift in thinking is transformational.
Bottom-up budgeting ties every dollar to pipeline performance, creating a transparent connection between spending and revenue results. Rather than starting with a percentage, you build your budget from the ground up using key metrics: annual revenue targets, Average Contract Value (ACV), conversion rates, Customer Acquisition Cost (CAC), and Customer Lifetime Value (LTV).
The LTV:CAC ratio becomes your north star. If it’s significantly higher than 3:1, you might be underspending and leaving growth on the table. Below 3:1 signals inefficiency that needs addressing. This metric-driven approach ensures budgets align with your specific growth stage, GTM strategy, and revenue goals—not generic industry standards.
Strategic Allocation and Continuous Optimization
Success isn’t about spending more; it’s about how you allocate every dollar. Consider this: a $6K CAC might be perfectly acceptable for a $50K product but unsustainable for a $12K offering. Context matters enormously, and absolute spend relative to product value determines viability.
Companies that win are those who allocate strategically, measure obsessively, and optimize constantly. This requires monthly and quarterly reviews with the flexibility to make small adjustments and stay agile. Your budget should reflect your revenue stage, clarify growth priorities, and build in room for course correction. Smaller budgets demand more precision, creative discipline, and smart tooling—but the fundamentals remain the same: tie spending to results, track critical metrics relentlessly, and let data guide your allocation decisions.
Conclusion: Tailoring Benchmarks to Your Unique Growth Journey
Benchmarks as a Starting Point, Not a Destination
Think of marketing spend benchmarks as a compass, not a map. Benchmarks validate your spend, they don’t dictate it. The real power lies in grounding your strategy in your current standing and future goals, rather than simply mirroring what competitors are doing. Your budget should align with your growth goals, funnel performance, and market opportunity—not just industry averages.
If your marketing budget falls significantly below benchmarks, it’s time to question whether your growth targets are realistic. Conversely, if you’re spending well above industry standards, you should either expect to outperform peers or re-evaluate how you’re allocating those resources. The key is cross-checking everything against your revenue targets, conversion rates, and sales cycle length to ensure strategic alignment.
Building Flexibility and Accountability Into Your Plan
Strategic investment based on what actually drives revenue for your specific business model is essential for consistently hitting growth targets. Translate budget percentages into a plan that aligns with your revenue goals, funnel performance, and unit economics. Build flexibility into your budget by setting aside 15-25% for tests and pivots—this agility is crucial as you scale.
Monitor your LTV:CAC ratio religiously. If it’s consistently above 3:1, you have room to scale marketing spend. If it’s below that threshold, focus on improving efficiency before increasing your budget. Review performance monthly and reforecast quarterly to stay nimble. Focus on clear, measurable goals like pipeline generation, customer acquisition cost, and revenue, then audit what’s working—CAC by channel, SQLs, and sales velocity—to reallocate funds effectively.
The Real Winners Tie Every Dollar to Results
Your budget should support your version of success, whether you’re bootstrapping or venture-backed. The real winners will be those who tie every dollar to a measurable result. Use allocation templates suited to your company’s stage and go-to-market strategy, then adjust based on your specific pipeline metrics. Rely on tried-and-tested models and schedule quarterly reviews for flexibility. Avoid long vendor contracts until you’re confident in their fit, and check budget allocation monthly to course-correct early.
Ready to optimize your marketing spend strategy? Contact us to develop a tailored marketing plan that drives measurable results for your growing business.
Note: This blog’s images are sourced from Freepik.